By: Paul Dickson, Director of Research and Giri Krishnan, Senior Portfolio Manager
Is the check engine light flickering?
Economic data has become more mixed with signs of both growth and fragility. If the Fed wants to engineer a “soft-landing,” or perhaps even the elusive “no-landing” scenario we discussed last quarter, it will have to start cutting interest rates sooner rather than later. We look to the September Fed Meeting as the start of a series of rate cuts.
The classic description of the Federal Reserve’s job (the Fed) is to know when to remove the punchbowl from the party. The punchbowl is low interest
rates -- or otherwise loose monetary policy -- that helps stimulate borrowing, spending, investment, and speculation. This leads to higher economic growth, related tightening labor markets, and eventually, higher inflation. Taking the punchbowl away through interest rate hikes dampens economic activity and brings the party to a close. Most of the time, a recession occurs, leading to higher unemployment and falling inflation due to economic contraction. This is not always the case, but as several pundits have warned, the Fed often waits for something to break before it acts. And by then, a recession may be inevitable.
Another analogy for the Fed’s job is car related. Fed policy needs to be calibrated to keep the engine running smoothly with enough fuel and lubrication to not overheat nor stall. Over the past few months, enough economic data releases have pointed to segments of the economy slowing that one might quip: “if the check engine light isn’t quite on, it’s probably flickering.”
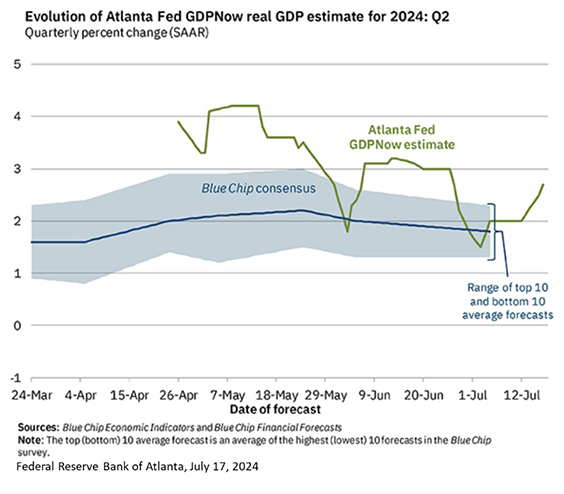
The outlook for Fed action depends on how that economic data is interpreted. The economy continues to expand at a modest pace, and the latest retail sales figures surprisingly leaned positively. This has led the Atlanta Fed’s GDP Now estimate for growth in the second quarter to rise to over 2.5%, differing significantly from consensus estimates that average below 2.0% (chart). Payrolls also continue to grow, with the latest two months each adding more than 200,000 non-farm employees to the total, exceeding estimates. These and other data points suggest an economy nowhere near recession even as both economic activity and the labor market are slowing modestly.
The next Federal Reserve Open Market Committee Meeting (FOMC) and decision on interest rates will be on July 31, likely just after this report is released. We do not expect a rate cut, but we expect the tone of the press release and question and answer session with Chair
Powell to be significantly more “dovish” than the previous meeting on June 12. At that time, Fed FOMC participants significantly revised their outlook for rate cuts from up to 3 to an average of 1 through the end of the year. They also opined that the projected path of rate cuts would be slowing in the coming years. The lack of significant progress on inflation was the key factor cited in the more “hawkish” posture.
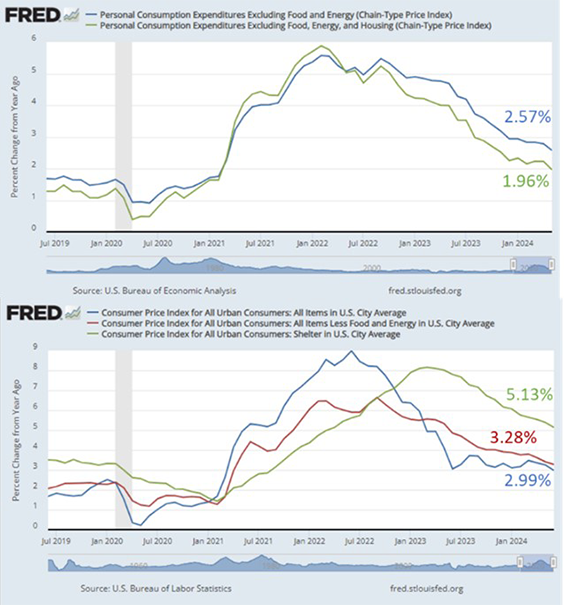
Recent data, however, significantly revises the narrative. While we won’t have the June measure of the Fed’s targeted inflation measure (the Personal Consumption Expenditures Index Ex-Food & Energy (PCE)) until the end of July, the June Consumer Price Index (CPI) figures provide some useful insight. Overall, consumer prices are rising at less than 3% year on year despite a third of the index being shelter, still rising at over 5% though declining steadily.
The Fed has no tools to address shelter inflation.
This supports the view that the Fed’s PCE measure is likely to continue trending downward. Adjusted for the stubborn housing price data, the measure is already below the Fed’s target and may convince officials they have done all they can on the inflation front without harming the economy. Fed rate hikes do not address the housing shortage; if anything, they exacerbate it. Higher rates make construction more expensive and worsen housing affordability.
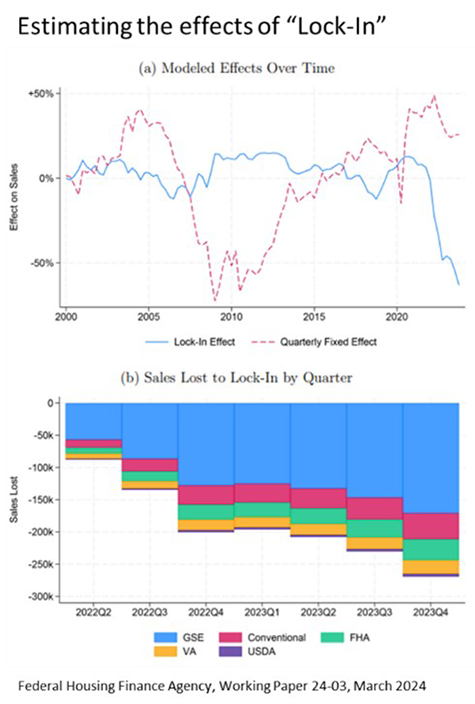
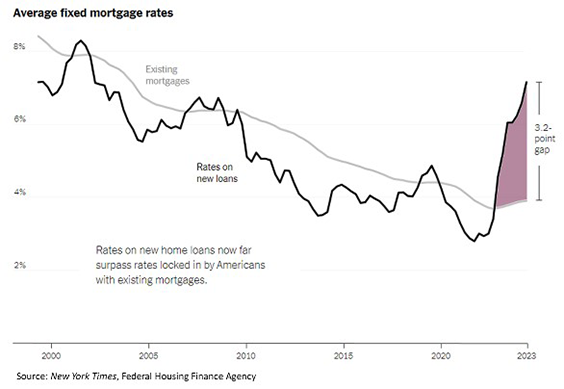
The difference between the average outstanding mortgage rate and the rate of a new one has caused a “lock-in” effect. A Federal Housing Finance Agency study estimates that hundreds of thousands in potential sales failed to materialize over the past two years because of it (charts).
A shortage of housing, coupled with the lock-in effect from mortgage rate differentials, has propelled housing prices higher. When coupled with the costs associated with the new higher mortgage rates, the U.S. Housing market is the least affordable it has been for many decades. According to the Atlanta Federal Reserve Bank, national home affordability is now worse than it was during the housing bubble of nearly 20 years ago.
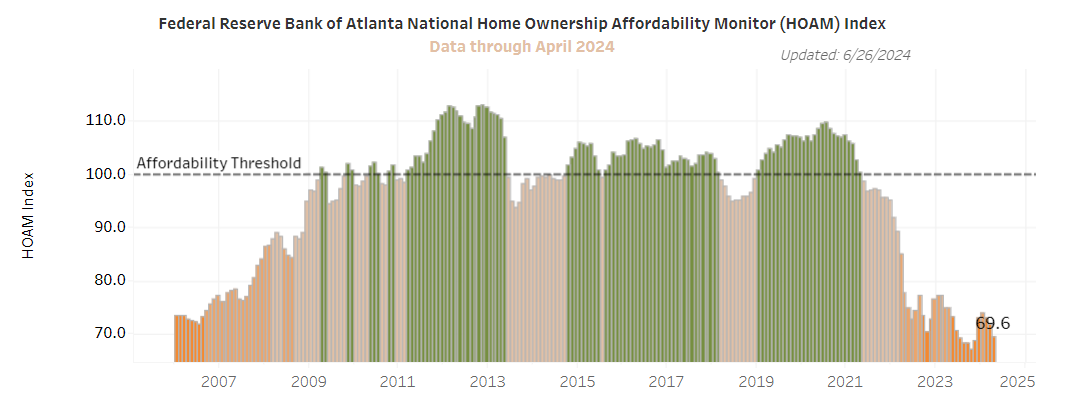
Signs of consumer stress mount
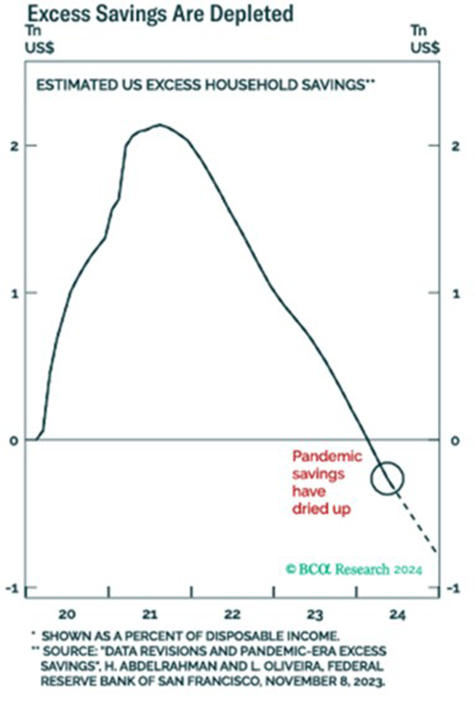
Another reason to expect the Fed to begin easing is mounting evidence that the consumer is increasingly stressed. Since the pandemic, one of the main drivers of economic activity has been the spending down of excess savings accumulated during the lockdowns to meet pent-up demand. The calculations vary, and some economists believe significant savings are still available, but there are reasons to believe that they have been spent. Economists with BCA calculate that the savings were depleted earlier this year. Even if this is not the case, whatever savings remain are not in the hands of those most prone to spend. While all income groups have seen their bank balances decline from the highs of pandemic saving, the lowest quantile are now considerably worse off.
Such data parallels the rapid increase in credit card balances and, more recently, a significant rise in payment delinquencies on nearly all types of borrowing. According to data from the New York Federal Reserve, credit cards and auto loan delinquencies have increased substantially and are at multi-year highs. Then, there is the anecdotal evidence of a stressed consumer, as reported by many companies who have noted an increase in price sensitivity and a decline in general demand on the part of the consumer. Coupled with a softening job market, the Fed will likely see the need to begin reintroducing the punchbowl before the check engine light starts burning steadily.

Markets In 2024 – The Global Economic Picture Is A Little Mixed, U.S. Markets Continue To Lead
2024 began with a more sanguine outlook, better market return expectations (than 2023), and implications for multiple rate cuts globally. At the start of the year, the expectation was for a slight moderation in global economic growth. This would lead to a better lending environment for businesses as rates ease globally, with some relief for the U.S. consumer who had depleted a chunk of their post-pandemic savings and persistent geopolitical risks. The one big change from the start of the prior year was that the ‘Don’t Fight the Fed’ mantra now was expected to imply a U.S. market tailwind rather than a headwind. This outlook came into play ever since the Federal Reserve made it clear both during FOMC meetings and impromptu speeches by various Fed governors that inflation was more under control than in the recent past.
Through the second quarter, the year’s S&P 500 returns have largely followed the pattern seen during prior Presidential election years. Markets typically rally in the first half of the year, and from now on, volatility typically picks up during months heading into the elections. We tend to see a relief rally around year-end once election outcomes are clear. Year-to-date, the S&P 500 is up a healthy 15%+, with sectors such as tech outperforming and real estate and materials sectors being the laggards. First-quarter laggards among the “Magnificent Seven,” such as Apple and Tesla, reversed their underperformance in the second quarter, while value-oriented sectors (e.g. financials, energy, and utilities) played catch up. Developed and emerging markets (EM) continued to notably lag the S&P 500’s performance, up only 5-7%, with markets such as India being the notable exceptions since they have rivaled the S&P 500’s return. Conversely, bonds continue to have another lackluster year, with U.S. bonds faring slightly better than global bonds.
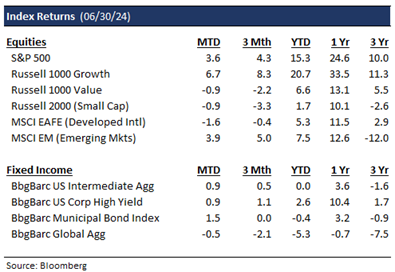
What’s Ahead: A Soft Or No Landing in the U.S., Higher Volatility Heading Into Elections, Easing Global Central Banks, and a Fed Rate Cut (or Two)
At the halfway point, year-to-date (YTD) U.S. equity market returns have largely exceeded investor expectations, which called for a rocky first half of the year, while most international markets have been relatively underwhelming. Broadly, market expectations called for a low to mid-single-digit return year for U.S. stocks and, with a few Federal rate cuts looming, for bonds to finally get past their toughest 2-year stretch in decades. Relative to the end of 2023, economic indicators have been mixed. For instance, U.S. Purchasing Managers’ Indices (PMI) (Services & Manufacturing) are in contraction mode, U.S. unemployment rate and jobless claims have ticked up, while Global PMI indices have largely been in expansion mode. U.S. second quarter GDP growth was revised higher, and the PCE has steadily abated closer to the Fed’s 2% target.
Rarely has there been this much of a disconnect between the economy and the markets, with the latter frontrunning an anticipated improvement in the former and acting a little disconnected from the trajectory of interest rates. The rally since 2023 has thrown some investors for a loop. Traditionally reliable recessionary indicators, such as the inverted yield curve, which normally foreshadow a recession within an 18-month period, have not been as accurate this time (or maybe will have delayed impact) given that we have now had an inverted yield curve for nearly 27 months. If one assumes that the current U.S. equity bull market in equities began in October of 2022, that would put its current length at 21 months. This would exceed the median bull market duration going as far back as the 1920s. Of course, the magnitude of this bull market 50%+ rally is still well below the median bull market gain (since 1929) of 75%+. However, much of the S&P 500’s run has largely been driven by the “Magnificent Seven” stocks (except Tesla), which have accounted for 50%+ of the S&P 500’s run, and U.S. equity markets have once again trounced International. These developments suggest that further 2024 global equity market momentum would require a broadening out across other geographic markets and sectors.
Typically, the fourth year of a U.S. Presidential cycle has seen the second highest returns for the S&P 500, with the index posting an average 7.5% return and up ~75% of the time, with the exception of the years 2000 (which coincided with the dot com implosion) and 2008 (which coincided with the Great Financial Crisis). Thus far, U.S. equity markets have trended higher, consistent with history, and have experienced one of the best starts to a year since 2017. If history should repeat, U.S. markets should trend a little lower as volatility spikes in the months leading up to the election before we see a relief rally once we have a decisive winner for President. If the past few weeks following the first Presidential debate are any indication, U.S. markets seem to be bracing for higher odds of a Republican victory, as have prediction markets, since such a result would imply less stringent regulation, lower taxes, and a more market-friendly regime. Also, yields have increased a bit due to the inflation expectations from likely higher tariffs. While clients certainly have the first Presidential election rematch since the 1950s on their minds, our market views and portfolio management decisions are not influenced by political outcomes since 10-year U.S. equity market returns starting January 1 of election years have been a dead heat regardless of whether Democrats or Republicans are in control.
Also, the cliché ‘don’t fight the Fed’ should aid rather than hinder market performance in 2024 with inflation under control and heading toward the Fed’s 2% target and unemployment readings still relatively benign i.e. we still expect Fed rate cuts to be the norm this year. Typically, the Fed pauses at least ten months between the last rate hike (July 2023) and the first rate cut, and we expect that the first rate cut could be in September. We also expect the first rate cuts to arrive well before inflation reaches the 2% target, and we expect the economy to experience a soft or no landing.
Correspondingly, investor sentiment on stocks continues to remain bullish. The latest American Association of Individual Investors (AAII) survey showed that 49% of investors expect stock prices to rise over the next six months, while only 22% expect stock prices to fall, which would be 12% and 10% points above and below historical averages, respectively. Both bond and stock market activity have tracked this sentiment lately, with the Merrill Lynch Option Volatility Estimate (MOVE) and Chicago Board Options Exchange’s CBOE Volatility Index (VIX) indices (gauges of U.S. interest rate and S&P 500 market volatility) declining since October, and this investor complacency implies elevated volatility later in the year.
Portfolio Implications – Core Bonds Still Appealing, U.S. Equities Ripe for a Sector Rotation, International Markets (Again) Offer Better Value, Liquid Alternatives a Welcome Diversifier
Ahead of the Fed’s tightening regime in 2023, we were rightfully skeptical of longer-term bonds and underweight duration, insulating the fixed-income portion of our portfolios against 2022’s hellacious year. While short-term cash-like instruments such as CDs, money-market funds, and shorter-term treasury bills made sense over much of 2023 with yields in the 5%+ range, pushing such assets recently to a record $6 trillion per the Investment Company Institute (ICI), the case for reallocating away from them and toward equities and intermediate-term bonds has gotten stronger with a dovish Fed.Historically, when the Fed is in pause mode and is gearing for rate cuts, core bonds or equities have outperformed cash in the years after the last rate hike since the latter faces greater re-investment risk in an easing cycle.
Within Fixed Income, we favor core bonds in the belly of the curve and have steadily increased the duration of our fixed-income portfolios to move closer to the Barclays U.S. Aggregate Bond index to lock in higher yields before the first-rate cuts arrive. Given that credit spreads for investment grade and high yield bonds remain tight and default rates are likely heading higher, we would advocate taking less credit risk and favor higher-quality bonds. With inflation declining faster than expected, especially as the key ‘shelter’ component of inflation indicators has finally tailed off, it appears increasingly likely that the next Fed move is a cut and not a hike, which would be favorable for intermediate to long-term bonds. We still believe bonds offer better risk/reward than stocks, based on the earnings yield (the inverse of the Price-to-Earnings or PE ratio) as a reliable gauge of value. While the S&P 500 currently trades at 21x times forward earnings, which implies an earnings yield below 5%, core bonds offer a higher yield and with a lot less drawdown risk. Historically, whenever U.S. equities have traded at these multiples, 5-year average forward returns have averaged 3% or lower. However, the caveat to this is the rest of the 493 stocks in the S&P 500 trade at 17x Forward PE, and the average stock in the S&P 500 has risen only 5% YTD. With U.S. bond yields closer to 5% and most global markets outside the U.S. trading at reasonable valuations, investors now have the chance to own robust, globally diversified portfolios that balance capital appreciation and income goals.
For equities, we have long been waiting for the sector rotation away from tech and toward cyclical or laggards like healthcare. Still, the equities rally in the U.S. through the first half of 2024 has only accentuated the divergence as tech valuations have gotten richer due in part to optimism around broader AI adoption and ongoing capex investment ramp up while laggards like healthcare and real estate have failed to build any momentum. In a sign of how relentless this market rally has been, 2024 has had one of the lowest number of 2% drawdown days for the S&P 500 and Nasdaq over the past decade. While last year’s U.S. equities run was primarily driven by an expansion of valuations given flat earnings-per-share (EPS) growth, this year’s rally has been driven by improving revenue, EPS growth, and higher share buybacks. Both the S&P 500 and the Nasdaq have surpassed all-time highs last seen in late 2021 and early 2022, and the ferocity of this rally has scalped quite a few permabears. The picture has not been as rosy for small caps, which after a furious end-of-2023 rally, still trade at cheap 15 times forward PE multiples. Typically, rate cuts bode well for this group, which is generally comprised of companies with more levered balance sheets and a higher cost of capital. If July’s divergence between the Russell 2000 vs. the S&P 500 (up +8% vs. +1%) is any indication, we believe the market may be pricing in a September rate cut. Typically, when equities have posted double-digit returns at the midway point of the year, those positive returns have continued into the second half of the year.
With second quarter earnings season having just kicked off, consensus earnings estimates project 2024 Year-over-Year (YoY) earnings growth of around 11% to $244, with second quarter YoY EPS growth projected to be 9%, the highest since the first quarter of 2022. Eight sectors are expected to report positive YoY earnings growth led by technology, communication services and energy, while the materials sector is among the three sector laggards with projected negative YoY earnings growth. We remain agnostic between growth and value, given we see signposts for both early and late cycle activity. We are keeping portfolios relatively style neutral with a bias toward large-cap equities despite a significant valuation premium over small-cap equities. Should the Fed ease faster than other global central banks, we see room for dollar weakness, making developed international markets (trading at a 20% discount to U.S. equity markets) and emerging markets (ex-China) more attractive. Admittedly, the past 10 years have been a tough stretch for EM, given that China (which accounts for 30% of the MSCI EM indices) has been a huge laggard since 2007’s market highs.
Lastly, a word on alternatives. Within our core diversified portfolios, we offer a healthy mix of equities, bonds, and liquid alternatives as an alternative to the industry standard 60/40 portfolio. Across most of our diversified core portfolios, we have broad exposure to liquid alternatives (e.g. hedged equity, infrastructure, option overlays), which have the potential to either boost income, enhance returns or hedge against downturns while having lower correlation to public market assets. For instance, a JP Morgan study shows over the past 30 years, modifying a 60/40 portfolio to a 40% Equities/30% Fixed Income/30% Alternatives portfolio has the potential to reduce portfolio volatility by a third, while modestly enhancing returns. Should the economy show accelerated growth and lead to higher IPO, merger and acquisition and real estate transaction activity, this benefits strategies such as private equity & venture capital as the dry powder building up over the past couple of years can be put to work on private companies at rock bottom valuations. We also believe categories like private real estate may benefit as the rate cutting cycle begins potentially later this year, since this would encourage more commercial real estate (CRE) lending in areas like industrial and residential real estate once we get the benefit of better clarity around pricing & demand.
Stay tuned for our thoughts on these and other relevant market topics in the quarters ahead!
Wealth Management does not provide accounting, legal or tax advice. This information discusses general economic and market activity and is presented for informational purposes only and should not be construed as investment advice. Views and opinions expressed herein do not account for any specific investment objective, restrictions, and/or financial circumstances of any specific client. Investors are urged to consult with their financial advisors before buying or selling any securities.
Different types of investments involve varying degrees of risk, and there can be no assurance that any specific investment will either be suitable or profitable for a client’s investment portfolio. The investment return and principal value of investment securities will fluctuate based on a variety of factors, including, but not limited to, the type of investment, amount and timing of investments, changing market conditions, currency exchange differences, stability of financial and other markets, and diversification. The statements and opinions expressed in this article herein are those of the author as of the date of the article and are subject to change. Content and/or statistical data may be obtained from public sources and/or third-party arrangements and is believed to be reliable as of the date of the article.
Products offered through Wealth Management are not FDIC Insured, are not bank guaranteed and may lose value.


